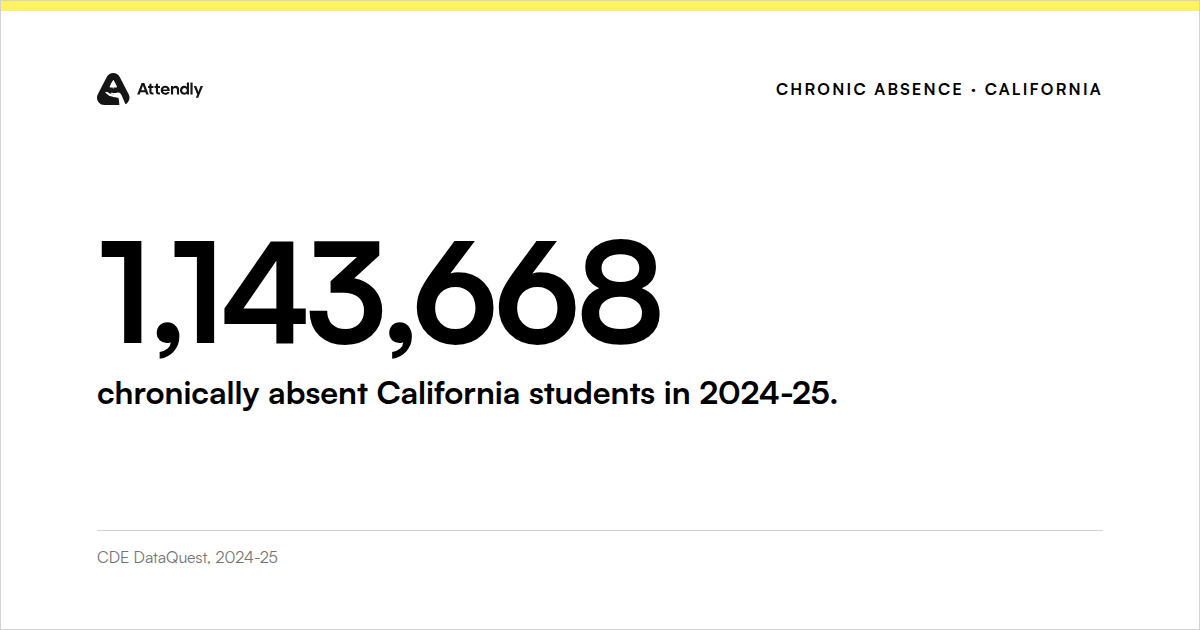

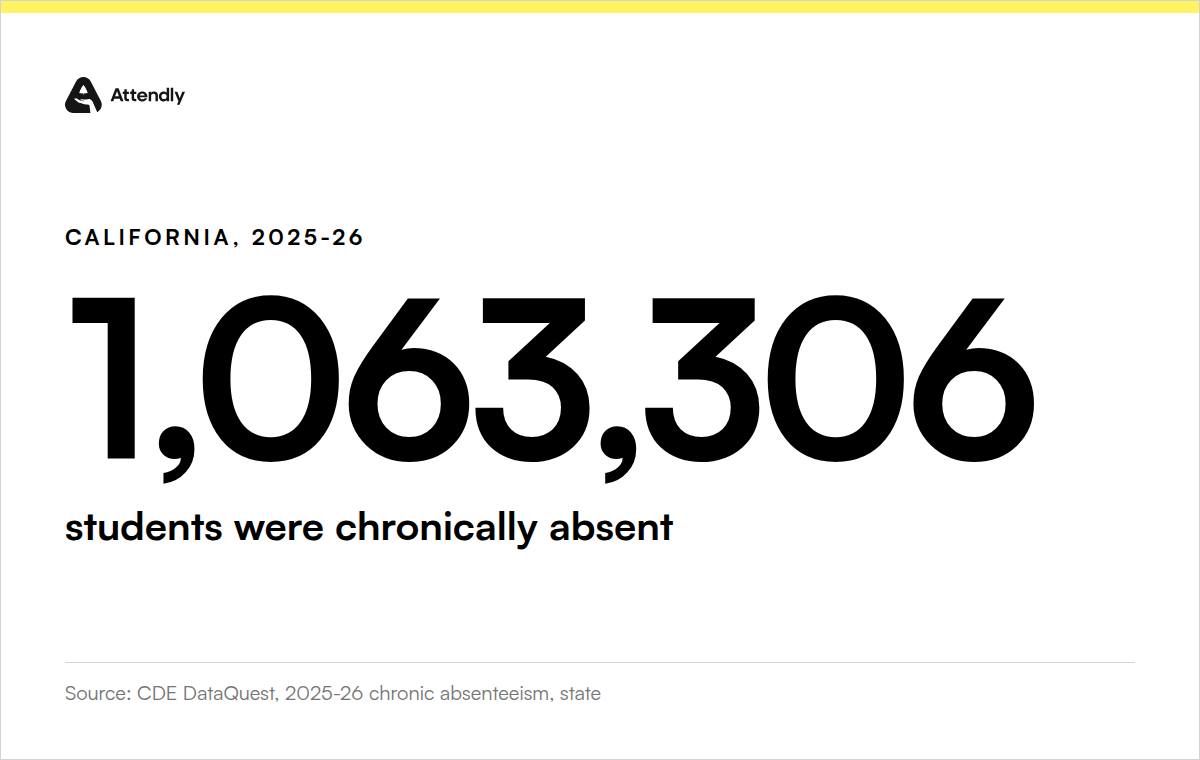
1,063,306. That is how many California students the 2025-26 DataQuest chronic absenteeism report counted as chronically absent. Eligible enrollment on the same report is 5,804,995. Last year’s count, which we walked in 1,143,668 Kids, was 1,143,668. The new file is out. Here is how to get your district’s number onto a board memo without mixing DataQuest, the download, and the Dashboard.
I checked the statewide total against CDE’s 2025-26 chronic absenteeism download (chronicabsenteeism26, updated 26-Oct-2026). Statewide row: Aggregate Level T, Charter School All, DASS All, Reporting Category TA. Same three numbers: 5,804,995 eligible, 1,063,306 chronically absent, 18.3 percent. LAist published the same 18.3 percent figure after CDE’s 2025-26 release.
A rate is a slide. A count is a caseload. Put the count first.
What CDE actually released
Three public surfaces now carry 2025-26 chronic absence. They are not interchangeable.
DataQuest, the download, and the Dashboard
| Surface | What it is for | What it is not |
|---|---|---|
| DataQuest | The official report. State, county, district, and school. Race, student group, and grade-span filters. The 2025-26 statewide report is live. | Not a pupil list. Not a Dashboard color. School rows do not sum to the district row. |
| Download | The same certified CALPADS EOY 1 counts in a text file, including every reporting category. CDE files page, file chronicabsenteeism26, last reviewed 26-Oct-2026. |
Not a substitute for your SIS. Districts and independently reporting charters that did not certify EOY 1 are left out, per that same files page. |
| Dashboard | Accountability colors for LEAs and schools that serve TK through grade 8. CDE's 2026 Chronic Absenteeism Indicator flyer is the rulebook. | Not a TK-12 kid count. High schools do not get this indicator. Recovered days under Education Code 46211 are not in the Dashboard calculation, per that flyer. |
Cite the surface you used. A green Dashboard cell and a DataQuest count can both be true and still not be the same number.
Education Code 60901 is the statute behind the count: a pupil absent on 10 percent or more of the schooldays enrolled, excused or not. CDE’s file structure is more specific for DataQuest. Chronically absent means the student was eligible at that reporting level and absent 10 percent or more of the days they were expected to attend. A day attended is any day the student attended for all or part of a school day. Eligible enrollment starts from cumulative enrollment and drops students expected to attend fewer than 31 instructional days, students enrolled who did not attend, and exempt statuses such as nonpublic school, home or hospital, or full-time community college.
Do not mix that eligible count with CBEDS enrollment. The board memo will argue with itself.
How to pull your district in 20 minutes
From the statewide report to three numbers on a memo
-
Open the 2025-26 report
Start at the statewide DataQuest chronic absenteeism report for 2025-26. Confirm the year in the heading is 2025-26, not 2024-25.
-
Switch the level to your district
Use DataQuest's level and name search. County first if the name is common. You want the district report, not a single school, for the cabinet packet.
-
Write three numbers
Chronic Absenteeism Eligible Enrollment. Chronic Absenteeism Count. Then the count at your highest elementary and your highest high school. Rates can sit in a footnote. The report definitions on that same page tell you what each column is.
-
Filter race and student group on the same page
The radio buttons under report options switch Race / Ethnicity, Student Group, and multi-year. Do not screenshot one view and call it the whole district.
-
If you need every school in one sheet, download the file
From the CDE chronic absenteeism files page, take
chronicabsenteeism26. For district totals, keep Aggregate Level D, Charter School All, DASS All, Reporting Category TA. For school totals, keep Aggregate Level S, Reporting Category TA, and both Yes and No on Charter School and DASS. School rows do not use All. Category codes are in the file structure.
DataQuest is the public report. The download is the same certified file in bulk. Your SIS is still the system of record for names.
Worked example, because a blank search box is where people stall. On the 2025-26 download, Los Angeles Unified (county 19, district 64733), Aggregate Level D, Charter All, DASS All, Reporting Category TA, shows 116,387 chronically absent students out of 505,895 eligible. Fresno Unified on the same filters shows 19,638 of 72,104. Oakland Unified shows 13,082 of 44,315. Those are district rows, not school sums. I am not going to add the school rows and pretend they match.
What the statewide file says once you open it
Keep using counts.
On the 2025-26 DataQuest statewide report, 686,438 of 3,247,149 eligible Hispanic or Latino students were chronically absent, and 86,653 of 284,264 eligible African American students. Those cells match Reporting Categories RH and RB on the download.
Grade spans on the same statewide download, Charter All, DASS All:
- TK and kindergarten (GRTKKN): 122,911 chronically absent of 587,448 eligible (CDE
chronicabsenteeism26) - Grades 1-3 (GR13): 175,092 of 1,182,051 (CDE download)
- Grades 4-6 (GR46): 183,172 of 1,283,082 (CDE download)
- Grades 7-8 (GR78): 152,997 of 878,893 (CDE download)
- Grades 9-12 (GR912): 429,134 of 1,873,521 (CDE download)
- TK-8 (GRTK8): 634,172 of 3,931,474 (CDE download)
TK-8 plus 9-12 is 1,063,306 on that statewide download. That is the statewide kid count again. High school is still a large pile, and the Dashboard will not show it.
Student groups on that same statewide download (Charter All, DASS All), using the codes in the file structure and the labels DataQuest uses on the Student Group view:
- Socioeconomically disadvantaged (SS): 865,990 of 3,775,324 eligible (CDE download)
- Students with disabilities (SD): 249,336 of 937,709 (CDE download)
- English learners (SE): 200,256 of 974,267 (CDE download)
- Homeless (SH): 87,319 of 257,425 (CDE download)
- Foster (SF): 13,106 of 35,431 (CDE download)
- Migrant (SM): 9,458 of 54,770 (CDE download)
Those groups overlap. Do not add them. DataQuest says so on the report.
The 2025-26 download has 1,009 district-level TA rows (Aggregate Level D, Charter All, DASS All). That is certified EOY 1 reporters in this file, not a count of every local educational agency in California.
Compared with 2024-25, the statewide chronically absent count fell by 80,362 students (from 1,143,668 to 1,063,306). Eligible enrollment also fell, from 5,903,507 to 5,804,995, on the two CDE downloads. Tell the board both facts. A smaller eligible pool is not the same as a smaller problem in your building.
Do not let the Dashboard eat the memo
The 2026 California School Dashboard went out with the aligned Oct. 15, 2026 release CDE described in its Dashboard and assessment toolkit. Chronic absenteeism on that Dashboard is a color. Status plus change. TK through grade 8 only, per the Chronic Absenteeism Indicator flyer.
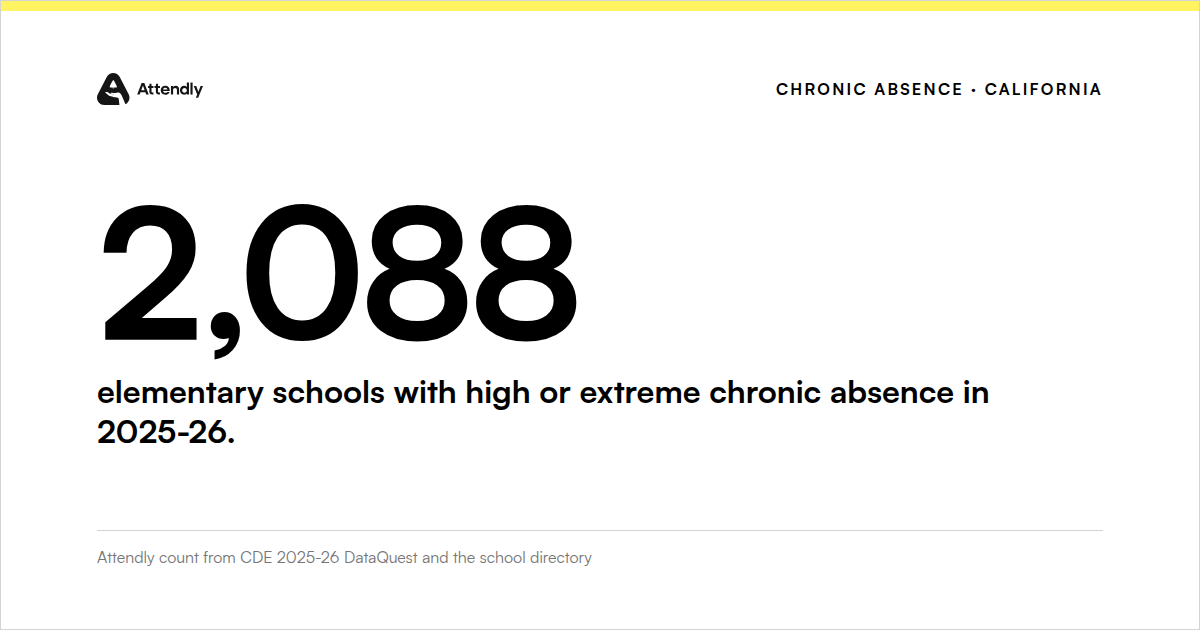
Attendance Works and PACE use different bands when they say high (20 percent up to, not including, 30 percent) and extreme (30 percent or more). That is the language in Unpacking California’s Chronic Absence Crisis Through 2024-25. Those bands are not Dashboard High or Very High. If you want the school list in that language, use the sibling count: 2,088 Elementary Schools With High or Extreme Chronic Absence.
CDE’s Attendance Recovery page describes an alternate chronic absenteeism rate that recovered days can feed. It does not rewrite the DataQuest rate you just pulled. The Dashboard flyer is blunter: attendance recovered under Education Code 46210 and 46211 is not in the Dashboard calculation. Saturday school is still Education Code 37223. Different file.
If the next move is extra instruction that can offset an absence, use the Attendance Recovery hub. If the next move is the truancy ladder, use SARB in California, Step by Step. Short-term independent study is a third statute. Pick one path per absence. Do not paste a Dashboard screenshot on all three.
A note on stars and sums
CDE suppresses a cell with an asterisk when eligible enrollment in that student population is 10 or fewer. Race/ethnicity “Not Reported” can also be suppressed if another race group is suppressed. A star is not a zero. It is privacy.
School counts are unduplicated at the school. District counts are unduplicated at the district. A student who moved in October is not yours to add twice. If fiscal “reconciles” DataQuest by summing sites, they will invent kids.
Your SIS remains the system of record for who was in the seat this morning. Attendly is the system of action after that. We read attendance and rosters from Aeries, PowerSchool, or Q SIS. We do not replace those systems, and they do not publish the CDE chronic absenteeism file for you.
When 2026-27 posts, I will send the new count. Stay on the list.
FAQ
Is 2025-26 chronic absenteeism data actually out? Yes. The DataQuest 2025-26 Chronic Absenteeism Rate report is live, and CDE’s files page lists chronicabsenteeism26 as updated 26-Oct-2026. That page’s last reviewed date is Monday, October 26, 2026.
When should we expect 2026-27? CDE has not posted a 2026-27 chronic absenteeism file yet. Beginning in 2026, the Dashboard itself is due by October 15 under Education Code 52064.5(f)(2), which CDE restates in the aligned release toolkit. Watch the files page and the DataQuest change log rather than a rumor in a cabinet meeting. I am not inventing a calendar day CDE has not printed.
Why does this post still mention 1,143,668? That is the 2024-25 statewide count, from DataQuest and from PACE and Attendance Works. Keep it for trend. Lead the new memo with 1,063,306.
Can I add school rows to check the district? No. DataQuest’s own note says counts are unduplicated at each level and are not summative. Use the district row for the district.
Does Attendance Recovery lower this DataQuest number? Not automatically. CDE describes an alternate rate. The Dashboard flyer says recovered days are out of the Dashboard calculation. Offer Recovery as extra instruction under Education Code 46211. Do not sell it as a color change.
What if our district is missing from the file? CDE omits districts and independently reporting charters that did not certify CALPADS EOY 1. Call your CALPADS coordinator before you tell the board the state “has no data on us.”
Sources
- CDE DataQuest, 2025-26 Chronic Absenteeism Rate, state
- CDE DataQuest, 2024-25 Chronic Absenteeism Rate, state
- CDE chronic absenteeism downloadable files, including
chronicabsenteeism26(updated 26-Oct-2026) andchronicabsenteeism25. Statewide totals use Aggregate Level T, Charter School All, DASS All, Reporting Category TA unless a category code is named. - CDE file structure: Chronic Absenteeism Data
- CDE DataQuest change log
- CDE Chronic Absenteeism Indicator, Dashboard toolkit (PDF, August 2026)
- CDE aligned Dashboard and assessment release (PDF, June 2026)
- California School Dashboard
- LAist on the 2025-26 statewide rate
- PACE and Attendance Works, February 2026 (PDF)
- Education Code 60901
- Education Code 46211
- Education Code 46210
- Education Code 37223
- Education Code 52064.5
- CDE Attendance Recovery
Where Attendly fits